AI Economics
AI Compute Economics: A Framework for Reading the Transition
A working paper from Brain AI. Prajakt Deotale, May 2026.
Executive summary
The AI build is the largest concentrated infrastructure cycle in technology history. The four largest hyperscalers will commit close to seven hundred billion dollars in 2026 alone. Capex commitments are tracking toward a trillion dollars in 2027. And yet the market cannot agree on what to make of it. The world's most influential capital allocators are publicly disagreeing about whether this is a once-in-a-century opportunity or the start of a correction.
The disagreement is not noise. It is a sign that the analytical frameworks used to read AI compute economics have run out of vocabulary. Each camp picks the variables that suit its narrative and reaches the conclusion that suits the variables. None of the existing analyses integrates the moving parts: capex, revenue conversion, physical bottlenecks, demand elasticity, geopolitical concentration. Each matters, and each has been tracked in isolation. The interactions between them are where the action is, and where commentary is currently silent.
This paper offers a framework that integrates the moving parts. It introduces two metrics that fill the most obvious gaps in published analysis. The first asks how much of the announced capex actually becomes deployed compute on the schedule the market is pricing. Today the answer is roughly fifty five percent. The second asks where the money goes when unit costs fall. The answer is striking: roughly seventeen times more demand is being pulled into the system than would be expected from the cost decline alone, and that ratio is rising, not falling.
The strategic implication is that the bubble debate is the wrong debate. The real question is which transition the system unfolds into next, and on what timeline. This paper offers seven dimensions of structural pressure to watch, two ratios that condense them, and four years of post-ChatGPT data to anchor the reading. The framework will not predict the future. It gives executives a structured way to see where the system is, and to recognise the leading indicators of where it could go.
1. The wrong question
On April 29, 2026, the four largest hyperscalers reported earnings on the same evening. By the close of the next trading day, their stock reactions told four different stories. Alphabet rallied on a five billion dollar capex hike. Meta fell six percent on a ten billion dollar capex hike. Microsoft slid two and a half percent. Amazon traded sideways. The combined 2026 capex commitment from these four companies now stands at roughly seven hundred billion dollars, the largest concentrated infrastructure cycle in technology history. And yet the market cannot agree on what to make of it.
In the week that followed, two of the most influential voices in capital markets weighed in. Larry Fink told the Milken Institute conference on May 5 that the AI build is a supply crunch rather than a bubble, and called it a once-in-a-century investment opportunity that will require ten trillion dollars of US capex over the next decade or more. Jamie Dimon, speaking the next day at an event in New York, said the trillion dollar data centre cycle will make sense in aggregate, while adding that technology tends to pay for itself but not in a straight line, and that picking individual winners and losers within the cycle would be hard. Two extraordinary statements from two of the world's most powerful capital allocators, on consecutive days. Both rejected the bubble framing. Neither offered the analytical infrastructure their position implies.
The market fragmentation around these positions is not noise. It is an honest acknowledgment that the existing analytical frameworks have run out of vocabulary. Capex to revenue ratios tell one story. Backlog conversion tells another. Physical bottlenecks tell a third. Credit market concentration tells a fourth. Each camp is right about its own variable. None is right about the system as a whole.
This paper offers a different way to read AI compute economics. It treats the system as a transition story across multiple structural forces, and shows how the interaction of those forces produces the conditions investors are now pricing differently for different companies. It introduces two metrics that do not appear in any published analysis we could find. The Capex Translation Rate measures how much announced capex actually becomes deployed compute. The Efficiency Absorption Ratio measures how falling unit costs are converting into demand expansion. Together they explain why the same numbers can support such different interpretations.
The framework does not predict where the AI compute economy is going. It gives executives a structured way to read where it is, and to recognise the leading indicators of where it could go next. With capex commitments tracking toward a trillion dollars in 2027, the cost of reading the system wrong has become structural rather than tactical.
2. The five conditions
The framework treats AI compute economics as a system that moves between distinct states, much as macroeconomies move between expansion, recession and recovery. Five conditions capture the full range of states the system can occupy. They are not a sequence; the system can move between them in either direction.
Scarcity with Monetization. Demand is rising rapidly. Supply has not yet caught up. Capex is rising but the build cycle has not fully responded. Bottlenecks are emerging but not yet binding. Investors are constructive. This was the AI compute economy through most of 2023.
Catch-up Buildout. Demand remains strong. Capex has accelerated to match or exceed demand growth. Physical bottlenecks are now binding the rate at which capex translates into deployable supply. Investors are watching closely but not punishing. This has been the dominant condition through 2024 and 2025.
Catch-up Buildout with Vapor Capex. Same as Catch-up Buildout, with one critical addition: announced capex is materially overstating the compute that will actually deploy on schedule. The gap between announcement and deployment becomes a structural feature.
Balanced Expansion. Demand and supply grow in line. Bottlenecks are managed. Adoption broadens beyond frontier model providers and into enterprise production. This is the condition the industry is trying to walk into. It has not been observed yet.
Speculative Overshoot. Demand softens or becomes concentrated in a few customers. Capex continues to rise because the build cycle has not yet pulled back. Bottlenecks ease as supply catches up to weakening demand. Investors begin punishing capex. Algorithmic efficiency stops pulling new demand into the system. This is the condition the bubble framing assumes is already underway. The framework does not see evidence of it today.
Correction and Digestion. Capex pulls back sharply. Excess capacity gets absorbed over multiple years. AI revenue continues to grow but the investment cycle becomes more disciplined. Speculative Overshoot leads here.
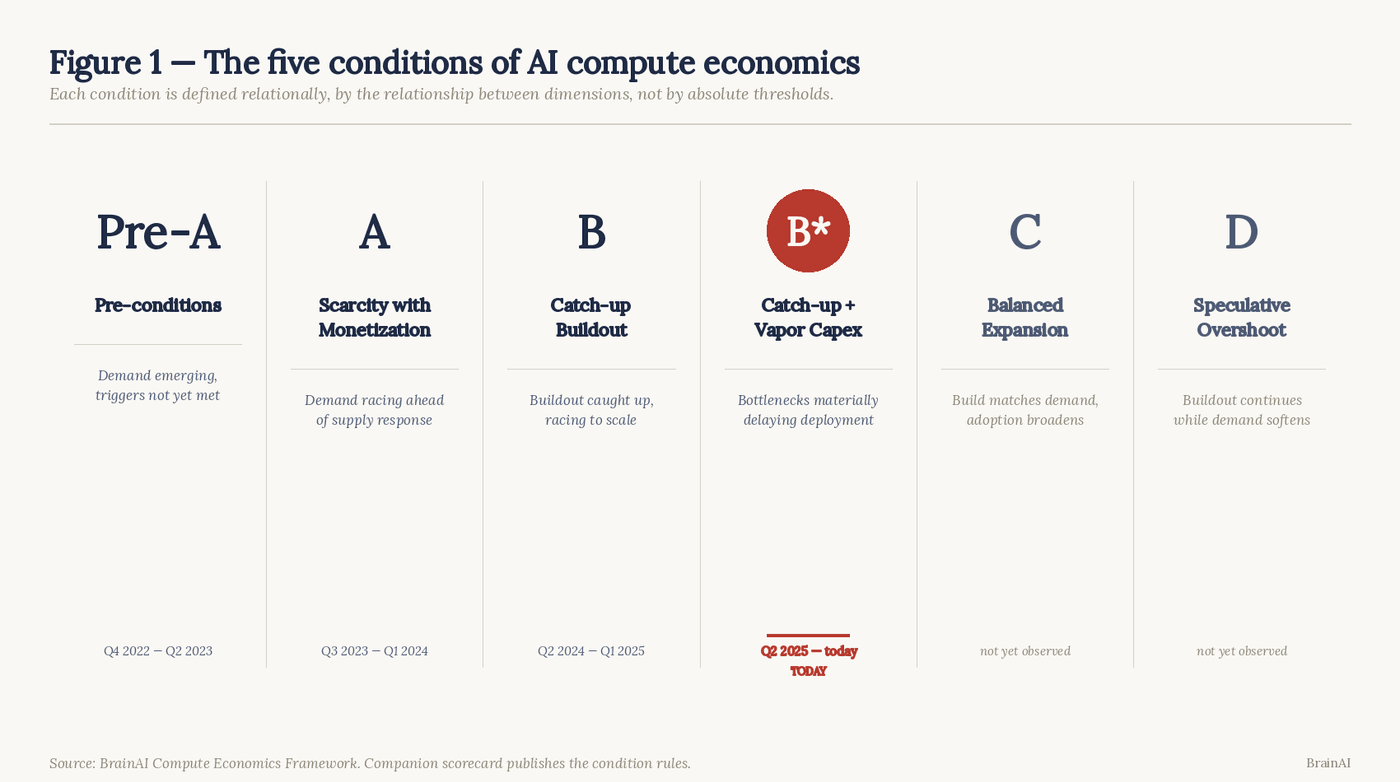
Each condition is defined relationally, by the relationship between dimensions, not by absolute thresholds. Scarcity is the condition where demand races ahead of supply response. Catch-up is the condition where buildout has caught up and is racing to scale. Overshoot is the condition where buildout continues while demand softens. The relational definition matters because the system can occupy the same condition at very different absolute scales.
A companion scorecard, published alongside this paper, classifies every quarter from late 2022 to early 2026 against these conditions, using seven structural dimensions and explicit rules.
3. Where we have been since November 2022
ChatGPT launched on November 30, 2022. From that moment to today, the AI compute economy has walked through four distinct conditions.
For most of 2023, the system was in Scarcity with Monetization. NVIDIA's data centre revenue went from 3.6 billion dollars in the fourth quarter of fiscal 2023 to 14.5 billion dollars just three quarters later. Hyperscaler capex was rising but had not yet fully responded. Microsoft extended its OpenAI partnership in January. Amazon committed to Anthropic in September. Demand was racing ahead of the supply response.
The transition to Catch-up Buildout happened in early 2024. Hyperscaler capex caught up to demand and then began to outpace it. Aggregate hyperscaler capex for 2024 came in around 240 billion dollars, a step change from the prior baseline. Memory costs began to climb, transformer lead times began to extend, and the physical bottlenecks that had been latent in the Scarcity period started to bind.
Through 2024 and into 2025, Catch-up Buildout deepened. Aggregate hyperscaler capex reached 400 to 450 billion dollars. NVIDIA's data centre revenue ran past 35 billion dollars per quarter. OpenAI hit a one billion dollar monthly run rate. Anthropic crossed seven billion dollars in annualised revenue mid-year, ended 2025 at roughly nine billion, and disclosed at its developer conference this week that the run rate had reached thirty billion in the first quarter of 2026. The build cycle was racing the demand cycle at scales the industry had never operated at before.
The shift to Catch-up Buildout with Vapor Capex came in mid 2025. Sightline Climate's pipeline tracking made clear that the volume of announced data centre capacity was running well ahead of the volume actually under construction. Memory contract prices spiked. SK Hynix declared its forward production sold out for 2026. The Capex Translation Rate dropped through 65 percent, the threshold at which announced capex begins to materially overstate near term deployable compute.
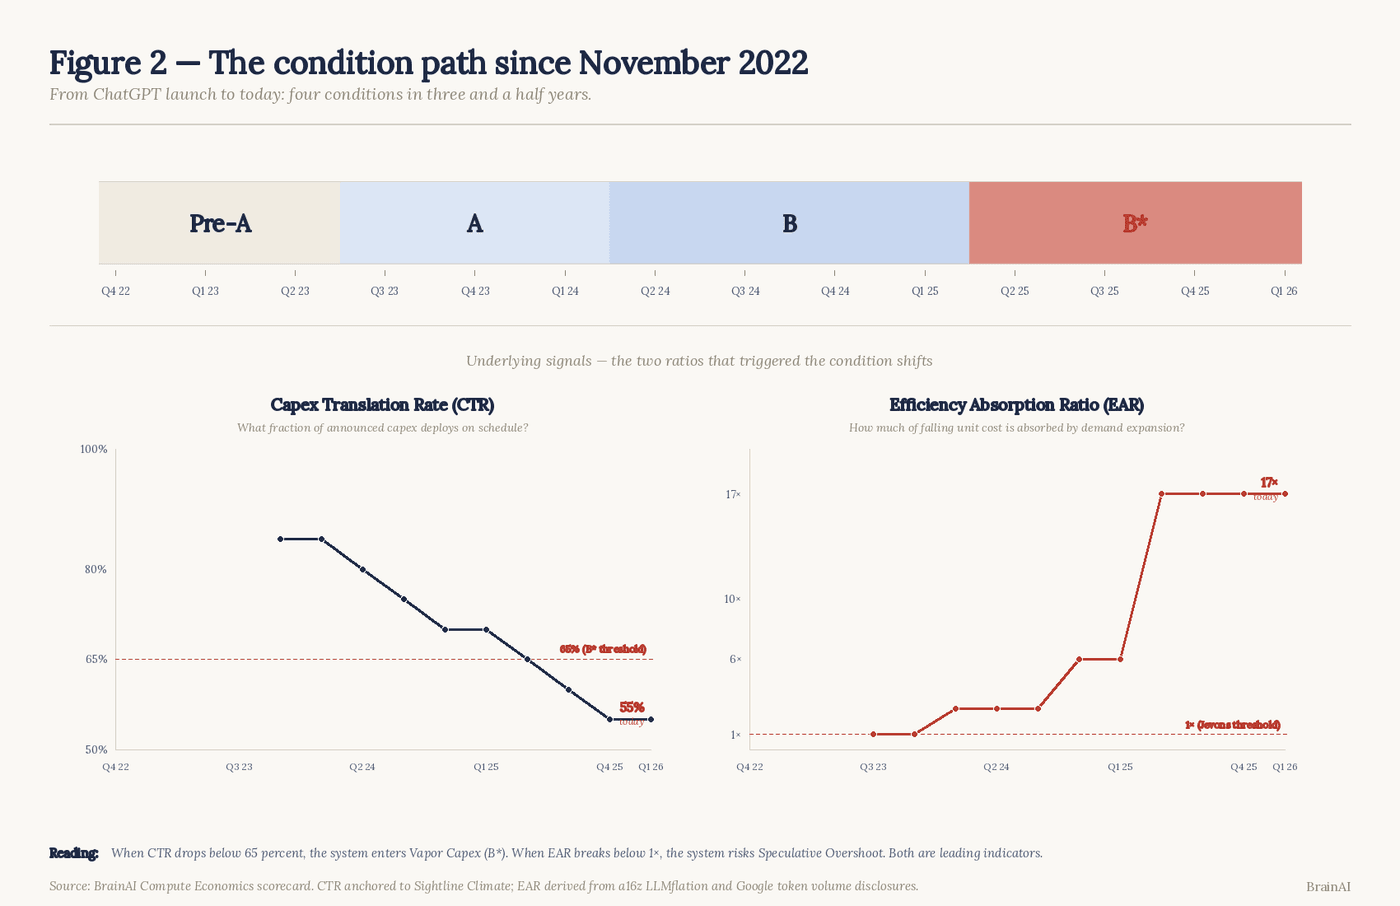
By the fourth quarter of 2025, a new pattern emerged. Investor pressure began to differentiate between hyperscalers. Capex announcements that would have been uniformly rewarded in 2024 now produced opposite reactions. Goldman Sachs reported that the correlation among hyperscaler stocks had fallen from around eighty percent at the start of the cycle to around twenty percent by year end. The system entered what the framework calls D-risk, the leading edge of delayed overshoot risk, while still primarily in Catch-up Buildout with Vapor Capex active. That is where today sits.
4. The two physical walls
The standard analyst chain runs as follows. Hyperscalers announce capex. Eighteen months later that capex becomes deployed compute. Compute serves demand. Demand generates revenue. The chain assumes capex translates one to one into deployed supply.
The chain is no longer accurate. Two physical walls now sit between announcement and deployment, and both are getting worse.
The first is the memory wall. Inference workloads are increasingly bound by memory bandwidth rather than by raw computation. The latency of an inference call cannot fall below the slower of two pipes feeding the GPU: the compute pipe or the memory pipe. For long context, agentic and reasoning workloads, the memory pipe dominates. High Bandwidth Memory has therefore become the actual scarcity. SK Hynix, Samsung and Micron supply almost the entire global market. Forward commitments from hyperscalers now extend three years, meaning every HBM stack through 2028 is already spoken for. Memory's share of hyperscaler data centre spending has risen from roughly seven percent in 2023 to around thirty percent in 2026. Microsoft attributed roughly twenty five billion dollars of its 2026 capex to higher component pricing, with memory the dominant driver. Meta's most recent capex hike was driven almost entirely by memory.
The second is the power and grid wall. Sightline Climate's early 2026 analysis showed that of sixteen gigawatts of US data centre capacity announced for completion in 2026, only about five gigawatts was actually under construction. Their projection was that thirty to fifty percent of the announced 2026 pipeline would slip past year end. The bottleneck is not money. It is high voltage transformers, with lead times of one hundred and forty four weeks, and grid interconnection queues that clear at perhaps one fifth of the rate that announced capacity would imply. Capital can buy a chip in months. Capital cannot manufacture a transformer.
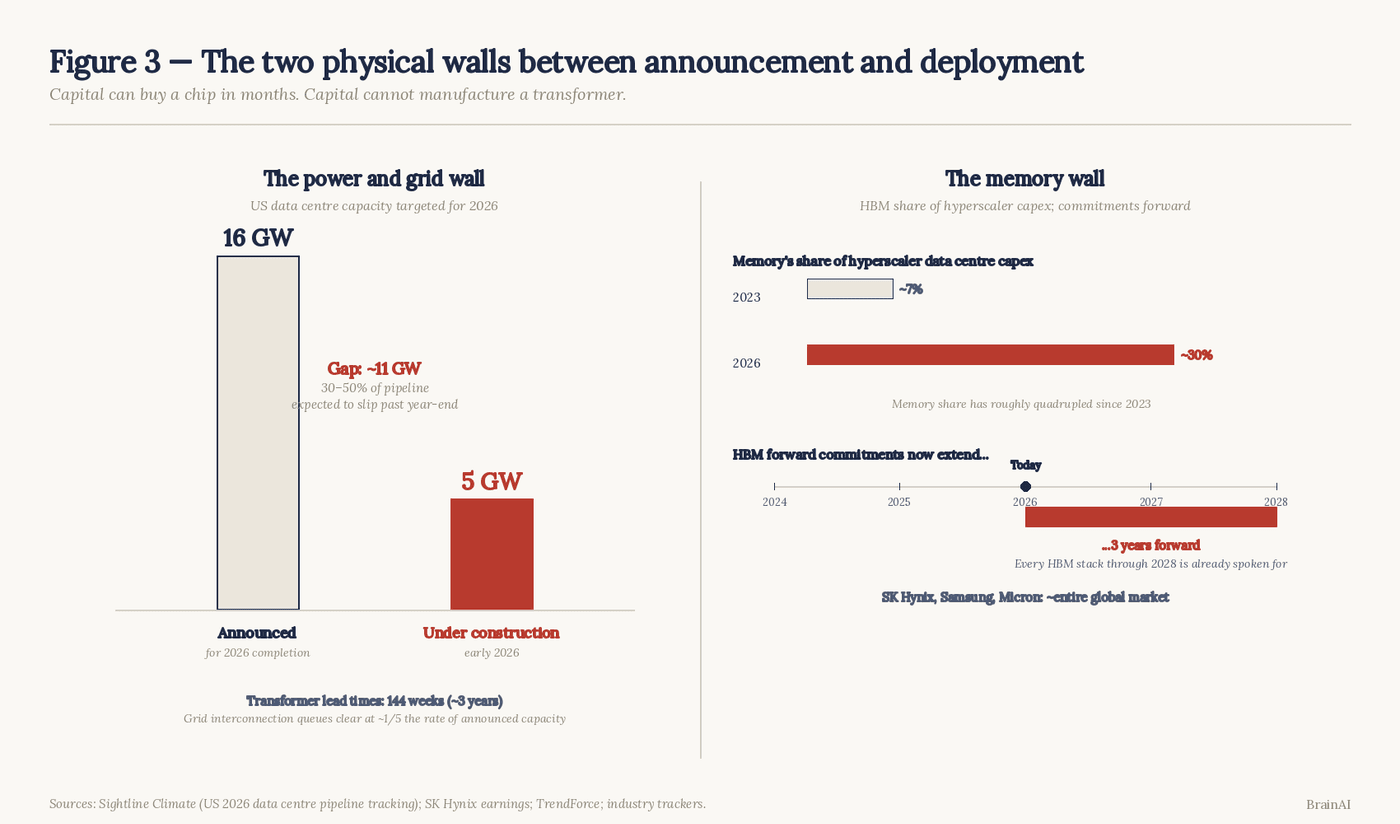
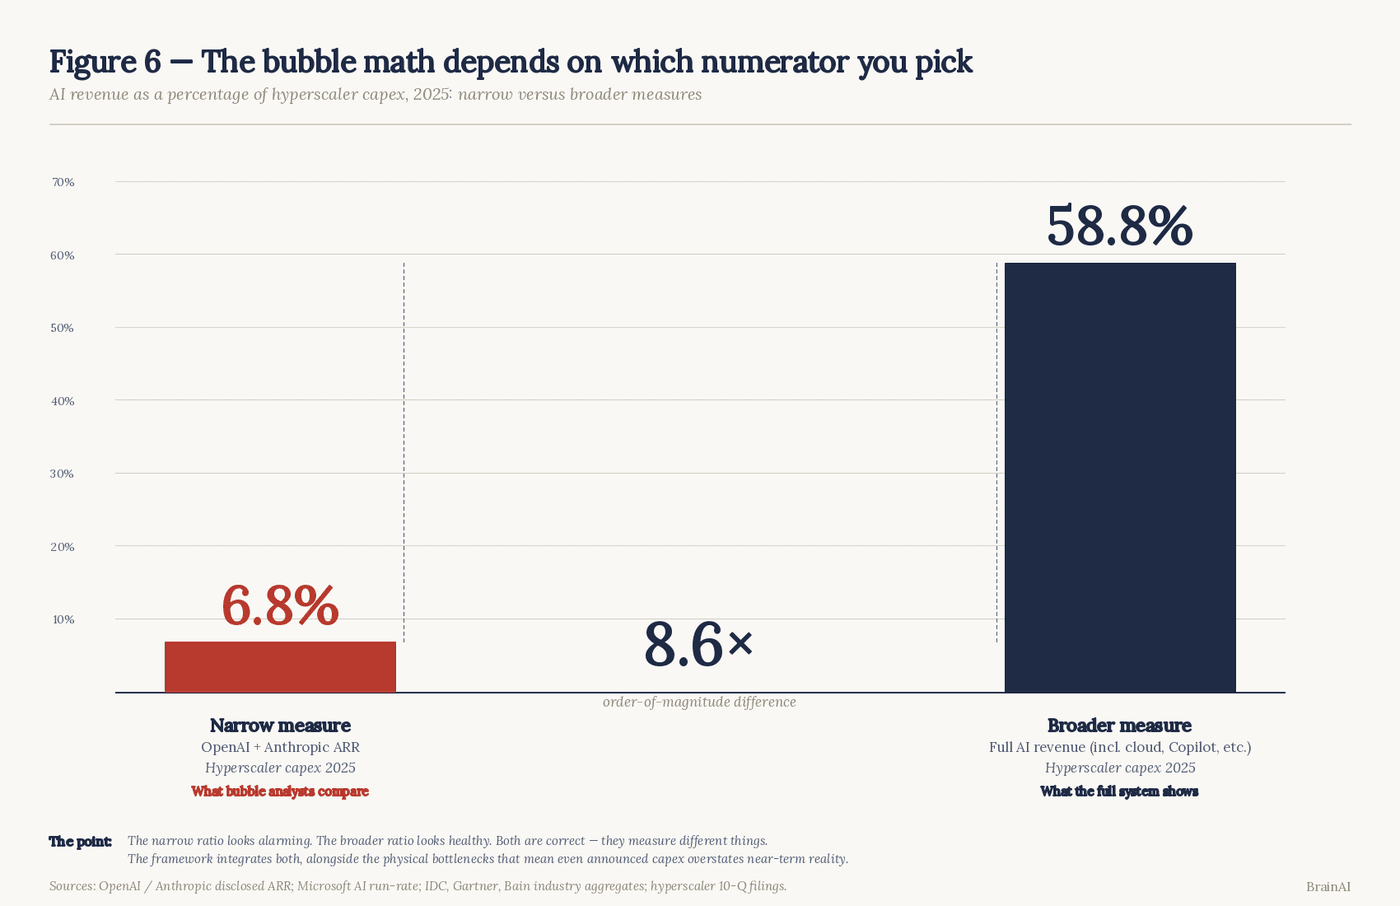
This is where the framework departs from the standard bubble math. When a Cahn-style or Goldman-style analysis takes announced capex, divides it by AI revenue and produces a ratio, the implicit assumption is that announced capex equals deployed compute. The two physical walls make that assumption wrong by a wide margin.
The supply chain workarounds are also revealing. This week, Anthropic disclosed it had secured three hundred megawatts of new compute capacity at the Colossus One data centre, a procurement arrangement that would have been unusual a year ago. When even the largest hyperscalers cannot meet your forward demand, you reach outside the conventional cloud channel. That is the supply crunch made visible at the procurement level.
Sidebar: why memory dominates inference latency. An inference call performs two operations in tight loops: matrix multiplications using the GPU's compute units, and reads of model weights and key-value cache from memory. The total latency cannot fall below the slower of these two operations. Formally, the time per token is bounded below by the maximum of compute time and memory access time. For long context windows and reasoning models, the key-value cache grows proportionally with sequence length and reasoning steps. At one million tokens of context, the cache consumes seventy to ninety percent of GPU memory and the memory pipe becomes saturated. Adding more compute does not help. Only faster or larger memory does.
5. The Capex Translation Rate
If announced capex no longer equals deployed compute, then any analysis comparing announced capex to revenue is comparing the wrong number to the right one. The Capex Translation Rate is the framework's response to that gap.
CTR measures the fraction of announced capex that converts into deployed, energised, revenue-generating compute within eighteen months. The eighteen month window is the standard build cycle assumed by analysts. Anything that arrives later is either deferred or phantom.
Today's CTR sits at roughly fifty five percent. The number is anchored to Sightline Climate's pipeline data. Of sixteen gigawatts announced for 2026, the midpoint of expected slippage implies that around sixty percent will reach commercial operation on schedule. We adjust modestly downward to account for the gap between coming online and being fully revenue generating.
Three implications follow.
First, the bubble debate is being held against the wrong denominator. When announced capex is compared to disclosed AI revenue, the gap looks alarming because the numerator overstates near term reality by something close to a factor of two. A more honest comparison would look at deployed compute against revenue, and the picture would be considerably less dramatic.
Second, today's apparent Catch-up Buildout is partly masked. The framework's CTR threshold of sixty five percent triggers the Vapor Capex condition. Today's reading of fifty five percent puts us inside that condition. Roughly forty five percent of announced capacity is at risk of arriving late or not at all on the schedule the market is currently pricing.
Third, the Vapor Capex condition creates a delayed overshoot risk. If the bottlenecks eventually clear, and they will, the deferred capacity arrives in waves. If demand has softened by then, the delayed wave arrives into a market that no longer needs it. That is the mechanism by which today's bottlenecks could mask tomorrow's overshoot. It is a transition risk the standard frameworks do not see, because they are not measuring the gap.
When Jamie Dimon said this week that the trillion dollar data centre cycle will make sense but that technology tends to pay for itself and not in a straight line, he was describing in plain English what CTR measures formally. A straight line implies announced capex equalling deployed compute on the analyst timeline. The line is not straight. CTR puts a number on how curved it has become.
6. Reasoning models and the memory wall
A natural response is to expect that algorithmic efficiency will save us. Inference costs have fallen by roughly an order of magnitude per year since 2023. By the cleanest benchmark, GPT-4 quality inference cost has fallen by a factor of around sixty in eighteen months. Surely the falling unit cost relieves the pressure on physical infrastructure?
The data says the opposite.
When unit costs fell tenfold over the past year, token volumes rose by considerably more. Google reported processing roughly one hundred times more tokens per month at the middle of 2025 than a year earlier. OpenAI's compute capacity grew from 0.2 gigawatts to 1.9 gigawatts between 2023 and 2025, a tenfold increase, while inference costs were collapsing. Enterprise generative AI spending grew roughly three hundred and twenty percent in 2025 even as per token costs fell by a factor of one thousand against the GPT-3 baseline.
This is Jevons paradox in real time. Falling unit costs are not relieving infrastructure pressure. They are intensifying it, by making AI feasible for use cases that were previously priced out. Each new use case adds tokens. Each token costs less but the total bill keeps rising.
This is also the supply side of the same story, articulated by the operator most affected by it. At Anthropic's developer conference this week, Dario Amodei disclosed that the company's revenue and usage had grown roughly eighty fold year over year in the first quarter of 2026, against an internal plan that had assumed tenfold growth, and said that this was the reason the company had experienced difficulties with compute. The most aggressive demand forecast inside one of the world's two leading AI labs was wrong by a factor of eight, on the upside, and the binding constraint was supply. Jevons paradox is no longer an analytical curiosity. It is the planning reality at the centre of the cycle.
Reasoning models make this worse. A reasoning model generates thousands of internal tokens before producing a final answer. Where ChatGPT used to respond to a one sentence question with a one sentence reply, a reasoning model now spends three minutes planning, twenty minutes searching, and five minutes writing. The output may be much better. Token consumption per task has risen by factors of fifty or more.
The interaction with the memory wall is the unobvious part. Reasoning workloads are memory bandwidth bound. The longer the reasoning trace, the larger the key-value cache, the more memory bandwidth each inference call requires. Algorithmic improvements that have driven cost reductions over the last two years have not relieved the memory wall. They have made it more binding. The frontier of AI is moving toward workloads that are precisely the workloads HBM was built for, at exactly the moment that HBM is the most constrained input in the entire stack.
Most AI economics work treats algorithmic efficiency as a tailwind that gets out of the way of the physical buildout. The data suggests the opposite. Efficiency is a demand multiplier that intensifies the physical buildout. It does not relieve scarcity. It deepens it.
7. The Efficiency Absorption Ratio
The Efficiency Absorption Ratio is the framework's response to that observation. It measures how much of the unit cost decline is being absorbed by demand expansion versus how much is being converted into cost savings.
The calculation is straightforward. Take the cost decline multiplier, expressed as how many times cheaper inference has become against a 2023 base. Take the volume expansion multiplier, expressed as how many times more inference is happening than in 2023. Divide volume by cost. The result is EAR.
By 2024, against a 2023 base, inference unit costs had fallen by roughly a factor of three while volume had risen by a factor of eight. EAR was approximately 2.7x. By 2025, costs were ten times cheaper and volumes were sixty times larger. EAR was approximately 6x. Today, costs are roughly thirty times cheaper than the 2023 baseline and volumes are roughly five hundred times larger. EAR is approximately 17x.
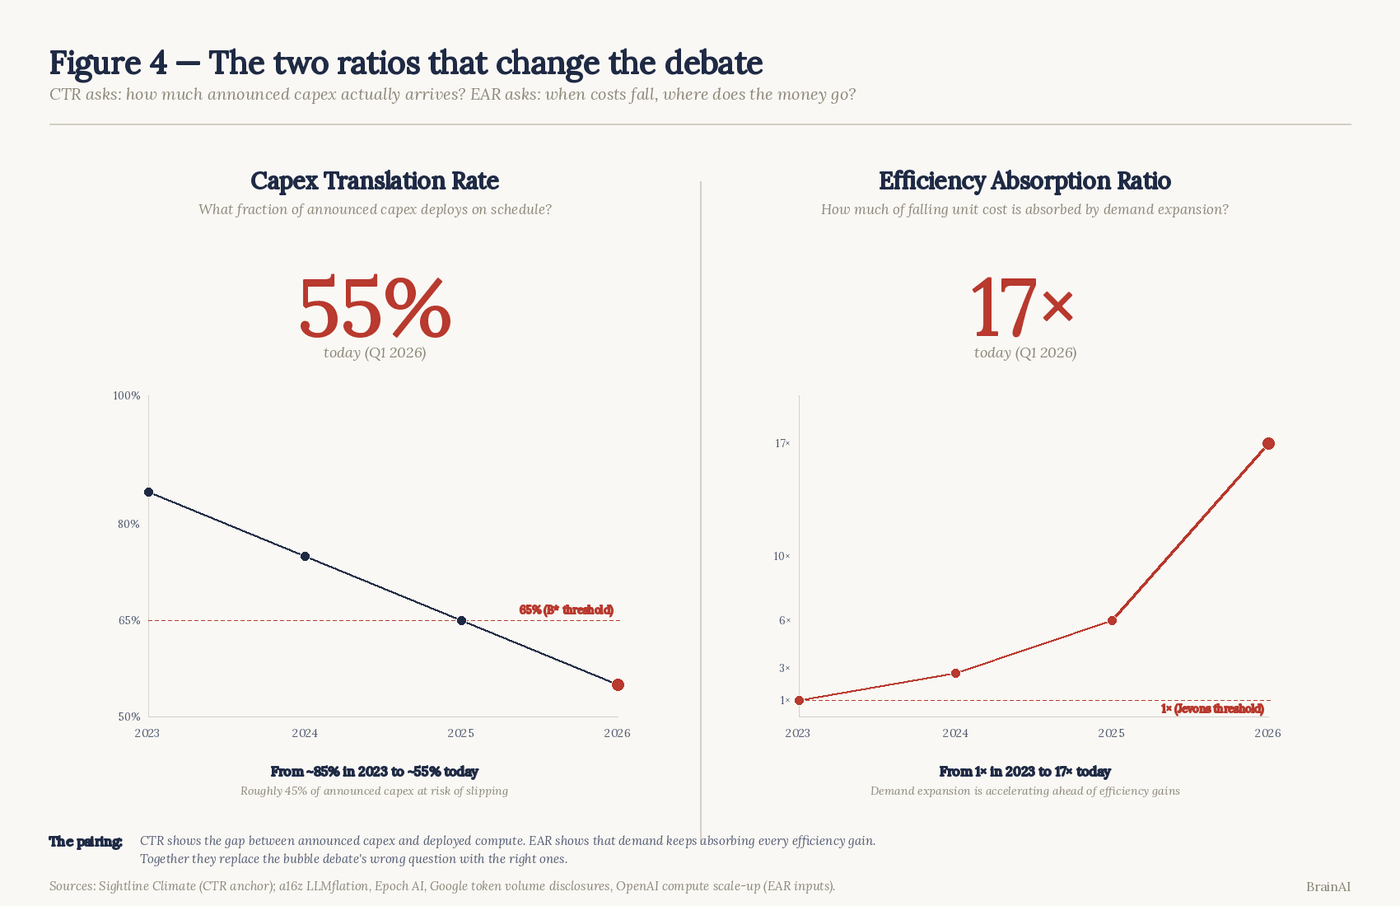
The number is striking, but the trajectory is the real story. EAR is rising, not falling. Each successive year, falling unit costs pull more incremental demand into the system than the year before. Demand expansion is not just keeping pace with efficiency gains. It is accelerating ahead of them.
The strategic implication is the most important point in the paper. The fibre glut of 2001 had no equivalent of EAR. When fibre supply ran ahead of demand, the price of bandwidth collapsed and demand did not absorb the excess for nearly a decade. The capacity sat idle. AI is not in that situation. If supply briefly runs ahead of demand, falling unit costs will pull additional demand into the system. The demand elasticity mechanism is structural and is functioning in real time.
This does not mean overshoot is impossible. It means overshoot would require EAR to break. A drop in EAR below 1x, which would mean falling unit costs were starting to convert into cost savings rather than demand expansion, would be the leading signal of a true regime transition. We have no evidence of that today.
CTR and EAR together change the bubble debate by replacing the wrong question with the right ones. CTR asks how much announced capex actually arrives. EAR asks where the money goes when costs fall. Together they produce a more honest picture than the analyses currently in market.
8. Five paths to 2030
The framework does not predict the future. It gives executives a structured way to read where the system is and what would have to be true for it to move in particular directions.
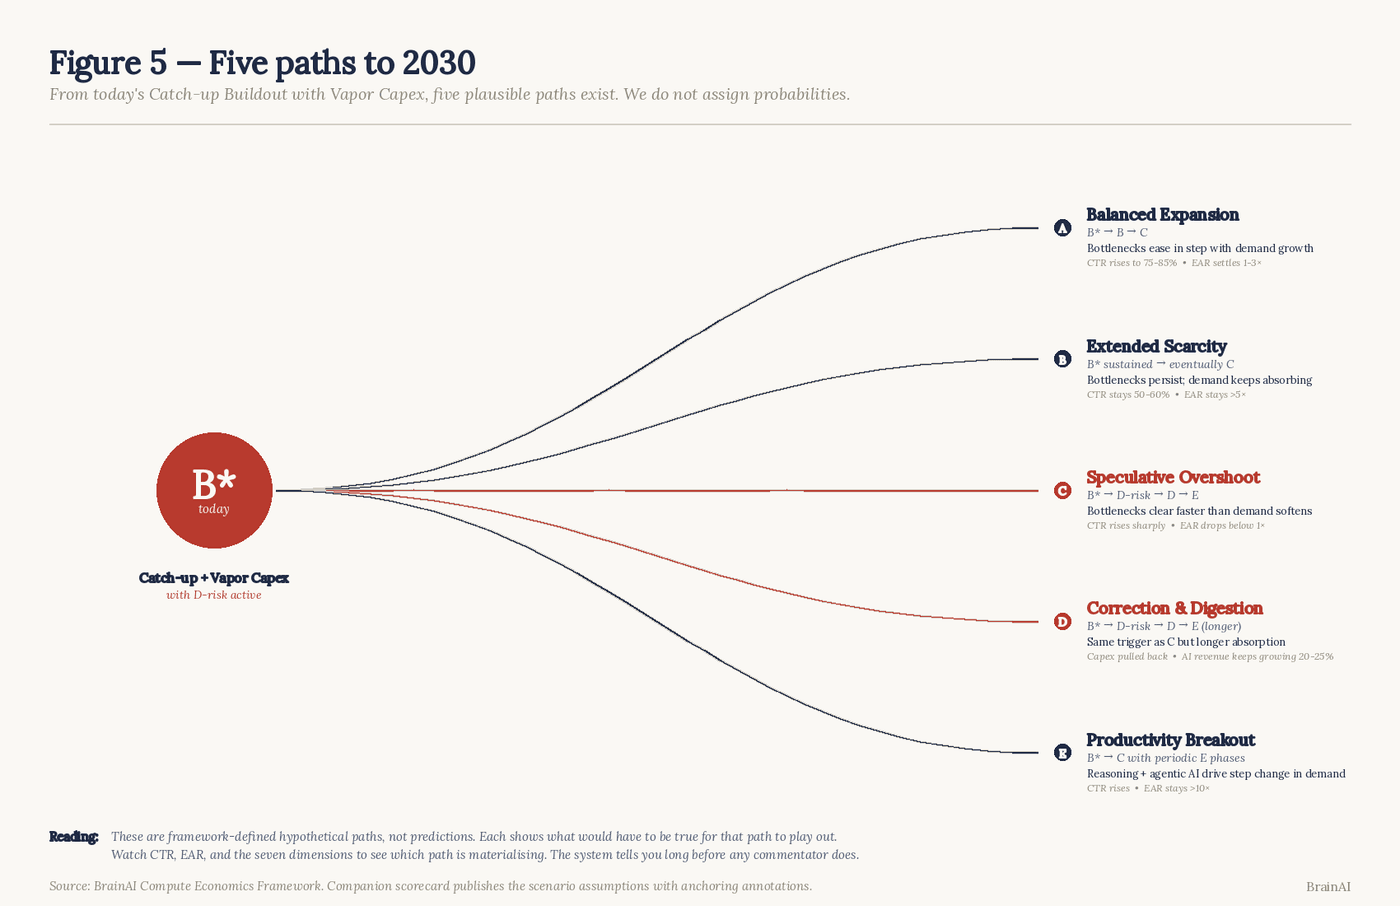
Balanced Expansion would require the bottlenecks to ease in step with demand growth. CTR rises from today's fifty five percent toward eighty percent by 2030 as memory capacity expands and transformer lead times normalise. AI revenue grows at thirty to forty percent annually, capex at fifteen to twenty percent. EAR settles into a healthy band of one to three times.
Extended Scarcity would require bottlenecks to persist. CTR stays in the fifty to sixty percent range through 2030. Demand keeps rising but supply cannot catch up. Pricing power is retained. EAR stays above five times.
Speculative Overshoot is the path the market is watching for. Bottlenecks clear faster than expected, perhaps because Samsung's Pyeongtaek memory capacity comes online in 2028 and transformer manufacturing scales by 2029. The deferred capacity from today's Vapor Capex condition arrives in a wave. Simultaneously, AI revenue growth slows or concentrates. EAR drops below one. At least one major hyperscaler announces a capex cut or write down. AI exposed equities reset.
Correction and Digestion is the same trigger as Speculative Overshoot but with a longer absorption period. Capex pulls back. Excess capacity gets absorbed over two or three years. AI revenue continues to grow at perhaps twenty to twenty five percent because demand never collapsed. The narrative shifts from more compute to more efficient compute.
Productivity Breakout is the most optimistic path. Reasoning and agentic AI drive a step change in enterprise demand starting in 2027. Inference costs continue falling but volumes rise faster. EAR stays above ten times. Memory becomes the binding global constraint. AI revenue grows at fifty percent or more for two to three years.
The geopolitical dimension cuts across all five paths. HBM is concentrated in Korea. Advanced packaging is concentrated in Taiwan. Transformer manufacturing is concentrated in a handful of US, European and Asian suppliers. In stressed scenarios, geopolitical concentration binds first. The new Samsung capacity at Pyeongtaek does not reach mass production until 2028.
We do not assign probabilities to these paths. With about fourteen quarters of post-ChatGPT data and at most one observed condition transition, probability assignments would be false precision. The honest framing is that here are five plausible paths, and here are the leading indicators that signal which one is unfolding. Watch CTR. Watch EAR. Watch the seven dimensions. The system will tell you which path is materialising long before any commentator does.
9. What this means for enterprise leaders
The framework supports three kinds of decisions.
The first is investment timing. If a leadership team is committing to multi-year AI infrastructure spend, the framework offers a way to read whether the system is in a condition that supports the commitment or whether deferring would be more disciplined. Today's reading suggests neither aggressive commitment nor full retreat. It suggests committing in stages, with explicit gates tied to the leading indicators.
The second is supplier strategy. The memory wall and the power wall will be binding for at least the next several years. Procurement strategies built on the assumption that compute and memory are commodities to be sourced opportunistically will struggle. Strategies built on multi-year supplier relationships, with explicit allocation guarantees, will hold up. The same applies to power and grid: enterprises with material AI infrastructure plans should be developing onsite generation strategies and grid interconnection optionality now.
The third is portfolio resilience, and this is where the framework speaks most directly to the moment. Most enterprises do not feel the memory wall or the power wall directly. They buy compute from a hyperscaler or AI provider, and the upstream bottleneck is hidden inside that relationship. But the bottleneck still reaches the enterprise as a second-order effect. It shows up as capacity availability for new workloads. It shows up as price changes. It shows up as which providers are able to deliver new capability quickly and which are stuck in queues. Larry Fink described what is unfolding as a K-shaped economy. Jamie Dimon, in the same week, warned that picking individual winners and losers within the AI cycle would be hard. Both observations are accurate. The framework explains why. The K-shape will play out across the providers your enterprise depends on, not across your own infrastructure decisions.
The implication is that counterparty assessment matters more than commitment scale. Some hyperscalers and AI providers will manage the upstream bottleneck better than others. Some will have secured forward HBM allocations, locked in transformer lead times, and built differentiated procurement strategies. Others will not. Anthropic's experience this quarter is the K-shape rendered concretely: eighty fold demand growth absorbed by a procurement strategy reaching outside conventional cloud channels. The companies that built supplier relationships years ago are scaling. The companies that did not are stalled. For an enterprise, the question is not how to secure forward HBM yourself. It is how to read which side of the K your providers are on. The framework's adoption maturity dimension and the underlying signal ledger give enterprises a structured way to assess these questions rather than relying on capex headlines.
The single most important implication is that the bubble debate, as it was framed in the financial press through 2024 and 2025, is the wrong debate to be participating in. It assumes a binary outcome when the actual question is which condition the system transitions into next. Enterprise leaders who position for a binary outcome will be wrong regardless of which side they pick.
10. Closing
Today the AI compute economy is in Catch-up Buildout with Vapor Capex active and delayed overshoot risk emerging. That is the framework's call as of May 2026. It is anchored in seven dimensions of structural pressure, two ratios that capture what announced numbers conceal, and four years of post-ChatGPT data. The companion scorecard makes every score, signal and rule available for inspection and challenge.
The bubble debate has effectively exhausted itself. With Fink and Dimon publicly rejecting the framing this month, the question that animated AI economics commentary through 2024 and 2025 is no longer the live one. The live question is which transition unfolds from here, and on what timeline. That is the question this framework was built to answer.
Two observations close the paper. The first is that AI compute economics is unlikely to follow the dotcom pattern. The dotcom analogy fails on three counts: hyperscaler valuations are nowhere near Cisco's peak, the buildout is funded primarily from operating cash flow rather than equity issuance, and AI demand has a working elasticity mechanism that fibre never had. EAR is not just a metric. It is the structural reason that catastrophic correction is harder for AI than it was for telecommunications.
The second is that the real risk in the system is transition risk. The question is whether the industry walks from today's Catch-up Buildout into Balanced Expansion, or from today's Vapor Capex condition into delayed overshoot. Both paths exist. Which one materialises depends on whether bottlenecks ease in step with demand or ahead of it, and on whether EAR stays above one or breaks below it.
Watch the indicators. The system will tell you which path is unfolding well before anyone else does.
The companion scorecard, which includes signal-level provenance, dimension scoring, condition rules, scenario assumptions and figure data, is published alongside this paper. All formulas, scores and assumptions are editable, so that readers can apply their own judgment and reach their own conclusions. The framework is intended to be argued with.
Published by Brain AI. BrainAI Systems Ltd builds the reasoning and governance layer that lets enterprises automate decisions they could not previously automate.